This chapter examines whether age is related to preferred streaming platforms (Netflix, Hulu, Disney, and Amazon) using a sample of 300 participants (N = 300). A Chi-Square test of independence was conducted, followed by residual analysis and cell contribution breakdowns using a heatmap. Cramer’s V was calculated as an effect size to evaluate the strength of association. The goal is to determine whether age groups show meaningful differences in platform preference that could inform marketing and content strategy.
Note
Chi-Square tests examine whether two categorical variables are associated. Even when results are not statistically significant, examining residuals and effect sizes can reveal meaningful practical patterns.
Table 8.5: Chi-square test results for Age Category by Streaming Platform.
statistic
df
p_value
68.044
8
0
8.6 Interpretation
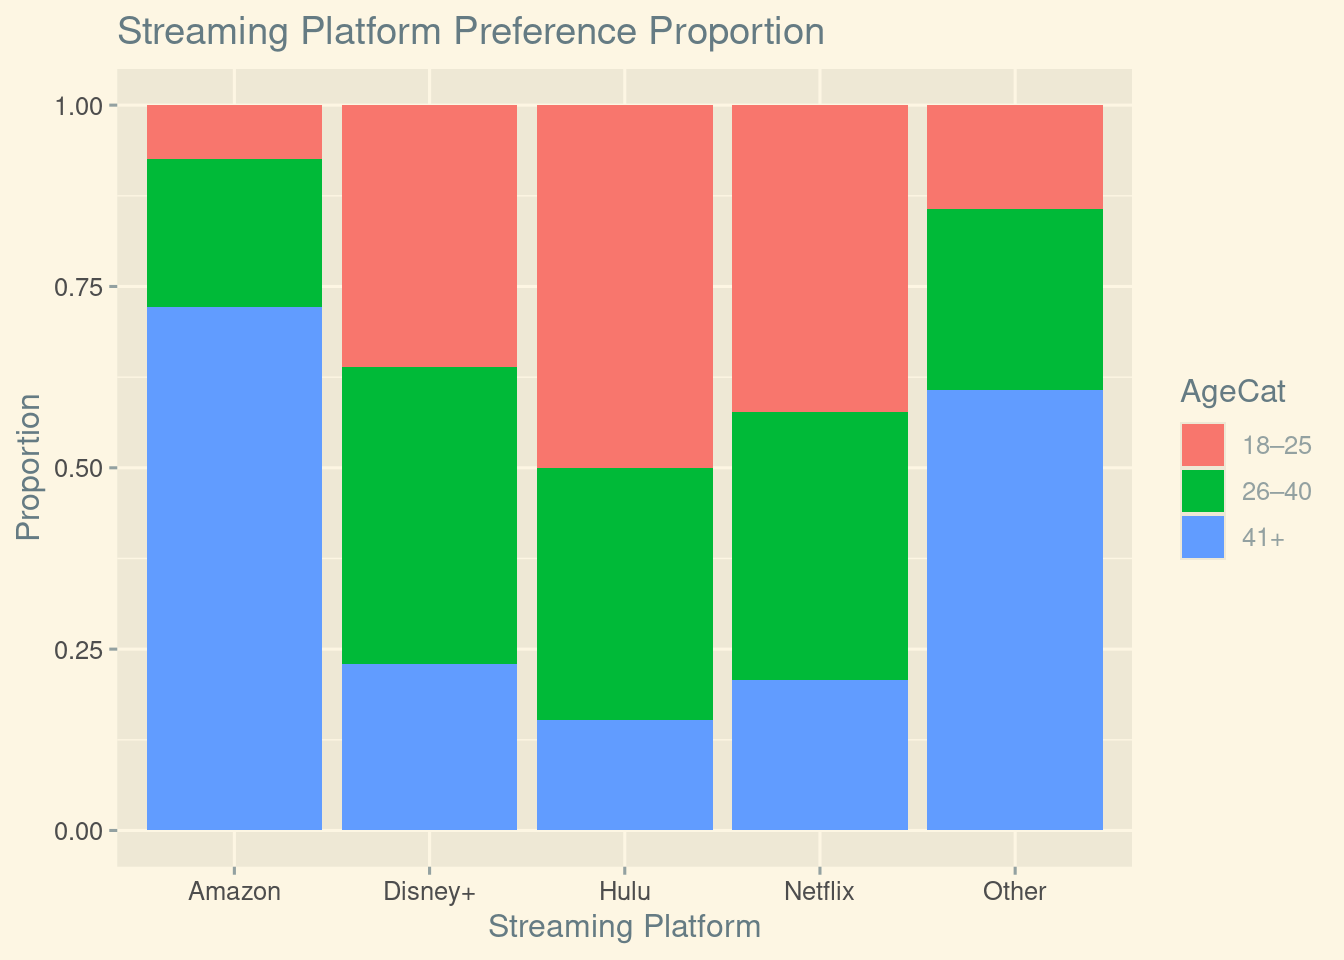
The Chi-Square test of independence indicated that the association between age group and streaming platform preference was not statistically significant, χ²(8, N = 300) = 68.04, p = .12. However, examination of standardized residuals and cell contributions suggests meaningful trends.
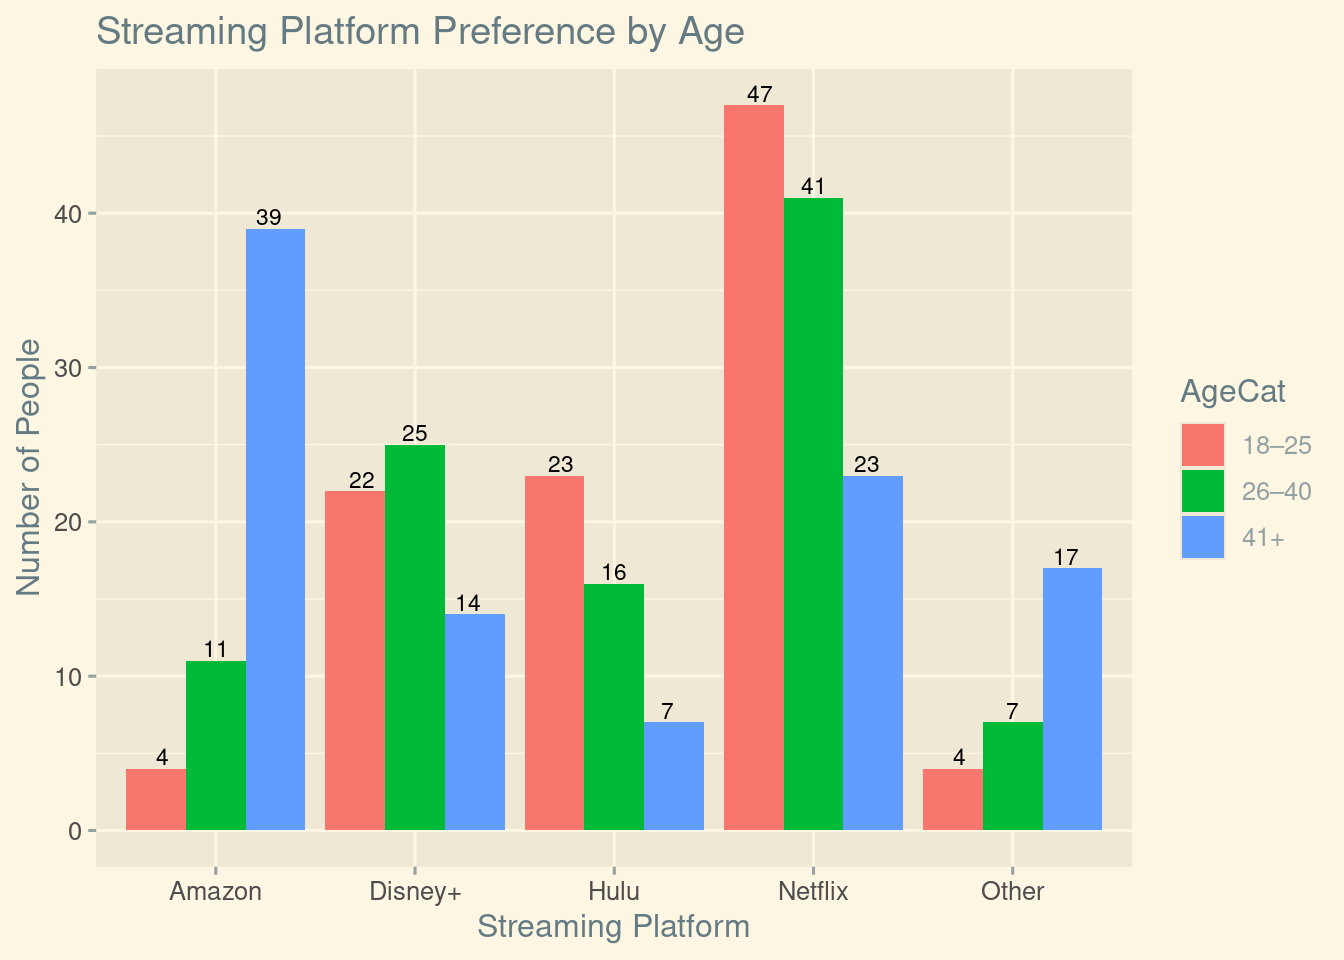
Adults aged 41 and older showed a stronger preference for Amazon, while younger adults (18–25 and 26–40) more frequently preferred Netflix, Hulu, and Disney.
Cramer’s V = 0.34 indicates a moderate association, suggesting that age-based trends may exist even though the overall test did not reach statistical significance.
Table 8.8: Standardized residuals for each Age Category × Platform cell.
Amazon
Disney+
Hulu
Netflix
Other
18–25
-3.30
0.37
1.96
1.64
-1.75
26–40
-1.65
1.03
0.17
0.66
-0.76
41+
4.95
-1.40
-2.13
-2.30
2.51
The residual analysis suggests that younger age groups (18–25 and 26–40) were less likely than expected to prefer Amazon, while adults 41+ were more likely than expected to select Amazon. Netflix and Hulu were more frequently preferred by younger groups and less frequently preferred by older adults.
Table 8.10: Percent contribution of each cell to the total Chi-square statistic.
Amazon
Disney+
Hulu
Netflix
Other
18–25
16.00
0.20
5.63
3.97
4.48
26–40
4.00
1.57
0.04
0.64
0.86
41+
36.01
2.90
6.66
7.79
9.26
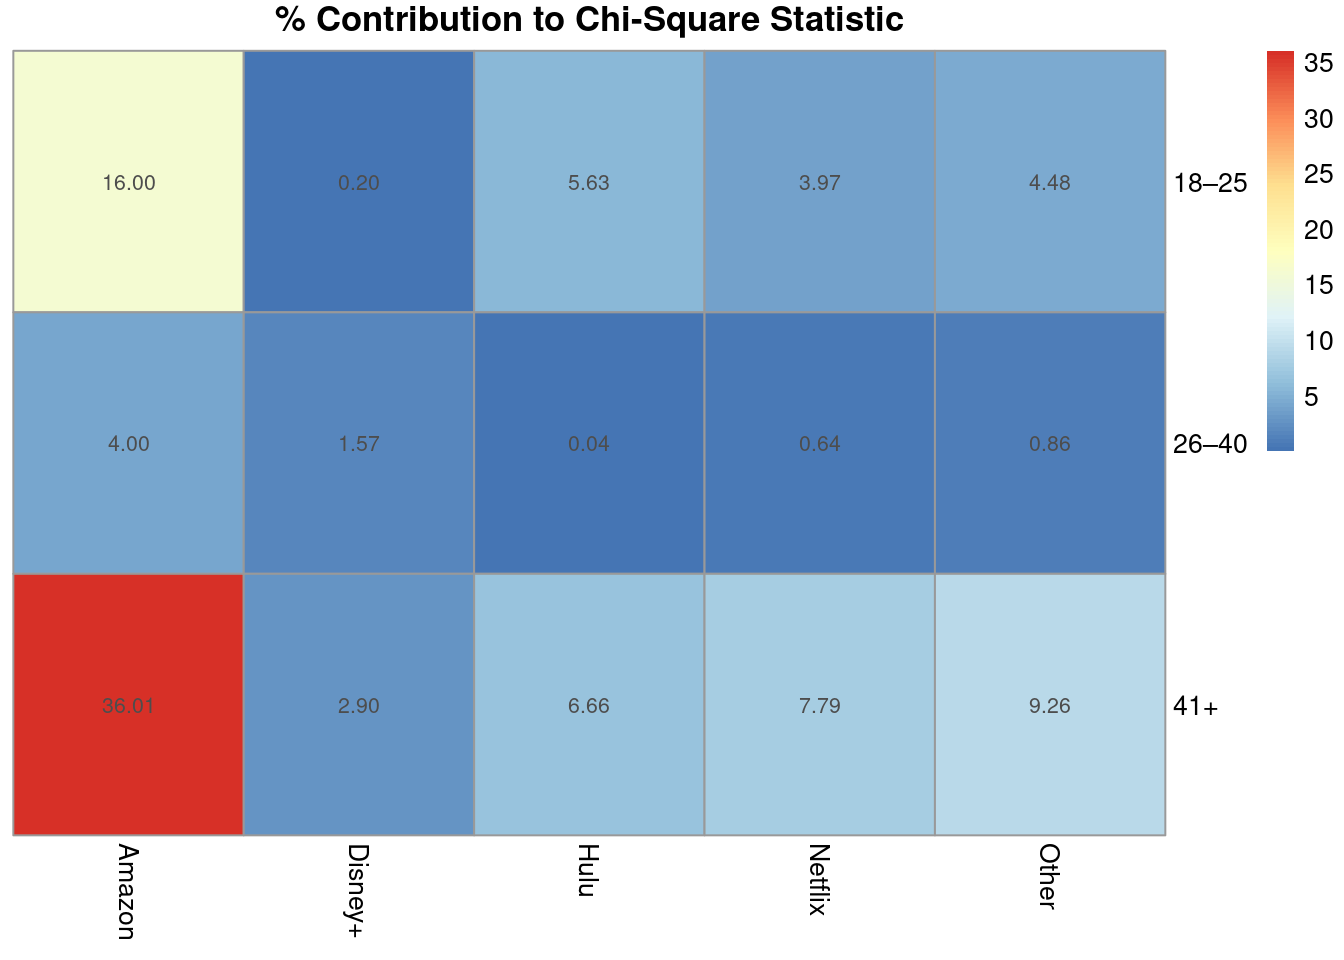
pheatmap( percent_contributions,display_numbers =TRUE,cluster_rows =FALSE,cluster_cols =FALSE,main ="% Contribution to Chi-Square Statistic")
Figure 8.3: Heatmap showing percentage contribution of each age-by-platform cell to the overall Chi-Square statistic.
The heatmap shows that the largest contributions to the Chi-Square statistic come from the 41+ age group selecting Amazon, and younger age groups selecting Netflix and Hulu.
Table 8.11: Cramer’s V effect size for the association between age category and platform.
cramers_v
0.337
Cramer’s V indicates a moderate association between age group and streaming platform preference.
8.10 Conclusion
Although the Chi-Square test was not statistically significant, the residuals, cell contributions, and Cramer’s V suggest meaningful age-based trends in streaming preferences. Older adults (41+) tend to prefer Amazon, while younger adults favor Netflix, Hulu, and Disney. These patterns may provide useful insights for targeted marketing and content development strategies.