load_team_data <- function(sheet_name, file_path = "NBA_Team_Total_Data2024-2025.xlsx") {
  df <- read_excel(file_path, sheet = sheet_name)

  df <- df %>%
    mutate(
      Team = sheet_name,
      Won_award = ifelse(is.na(Awards), 0, 1),
      PRA = PTS + TRB + AST,
      STOCKS = STL + BLK
    )

  return(df)
}

file_path <- "NBA_Team_Total_Data2024-2025.xlsx"
team_sheets <- excel_sheets(file_path)

all_teams_list <- lapply(team_sheets, load_team_data, file_path = file_path)
nba_data <- bind_rows(all_teams_list)6 Basketball
6.1 Introduction
This chapter explores NBA player performance using team total data from the 2024–2025 season. I create composite metrics for offense (PRA: points + rebounds + assists) and defense (STOCKS: steals + blocks), merge team-level conference information, and compare distributions across East vs. West. I use visualizations, point-biserial correlations, a correlation matrix, and partial correlation to examine relationships between age and performance metrics.
Note
This chapter demonstrates building composite metrics from raw stats, merging external lookups (conference), and using correlation-based analyses to evaluate relationships among variables.
6.2 Data Loading and Feature Engenering
conference_lookup <- read_excel("TeamConferences.xlsx")

nba_data <- nba_data %>%
  left_join(conference_lookup, by = "Team")

nba_data <- nba_data %>%
  mutate(Conference_binary = ifelse(.data$Conference == "East", 1L, 0L))
Tip
Conference is coded as a binary variable (1 = East, 0 = West) to support point-biserial correlations, which are equivalent to correlations between a continuous variable and a dichotomous group variable.
6.3 Visualizing Performance by Conference
ggplot(nba_data, aes(x = PRA, y = STOCKS, color = factor(Conference_binary))) +
  geom_point(size = 3, alpha = 0.7) +
  labs(
    color = "Conference (1 = East, 0 = West)",
    x = "PRA (Points + Rebounds + Assists)",
    y = "STOCKS (Steals + Blocks)",
    title = "Offensive vs Defensive Performance by Conference"
  ) +
  theme_minimal()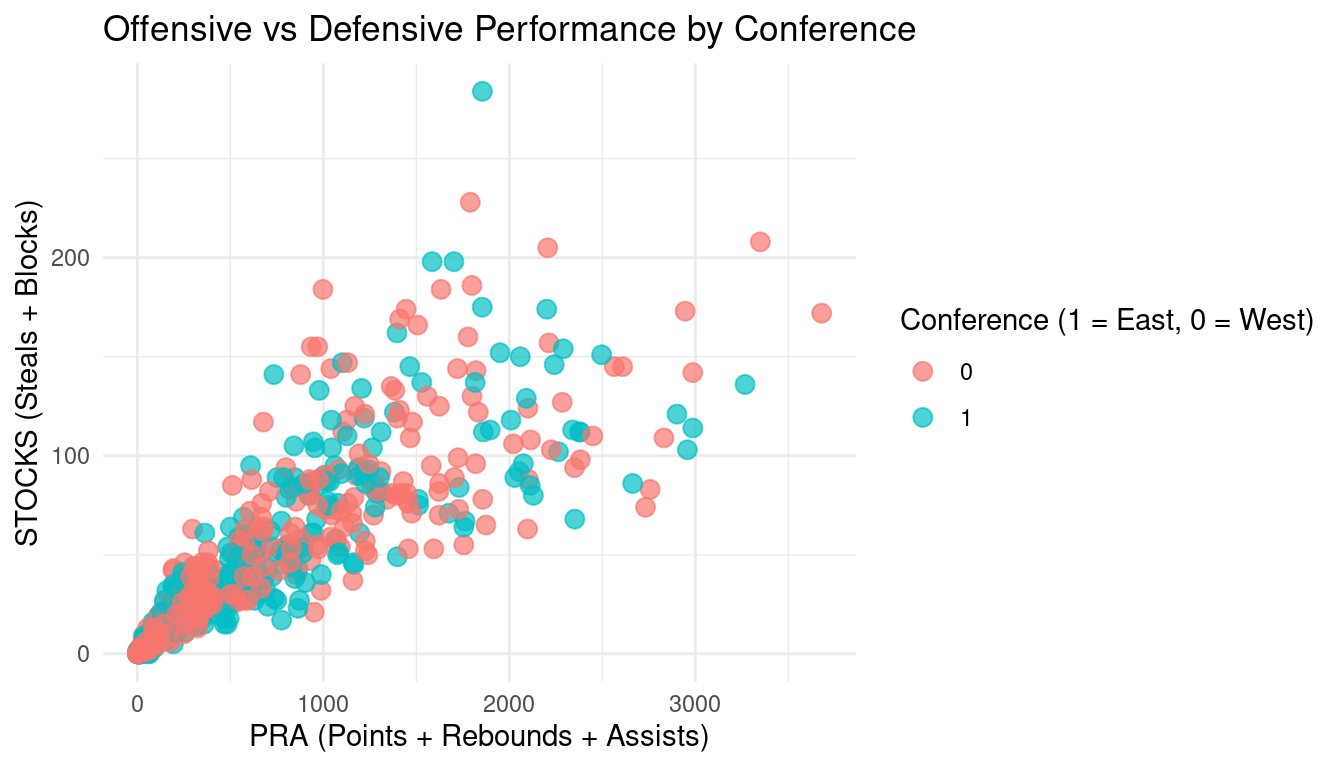
ggplot(nba_data, aes(x = PRA, fill = factor(Conference_binary))) +
  geom_histogram(position = "dodge", bins = 15, alpha = 0.7) +
  labs(
    fill = "Conference (1 = East, 0 = West)",
    x = "PRA",
    y = "Number of Players",
    title = "Distribution of PRA by Conference"
  ) +
  theme_minimal()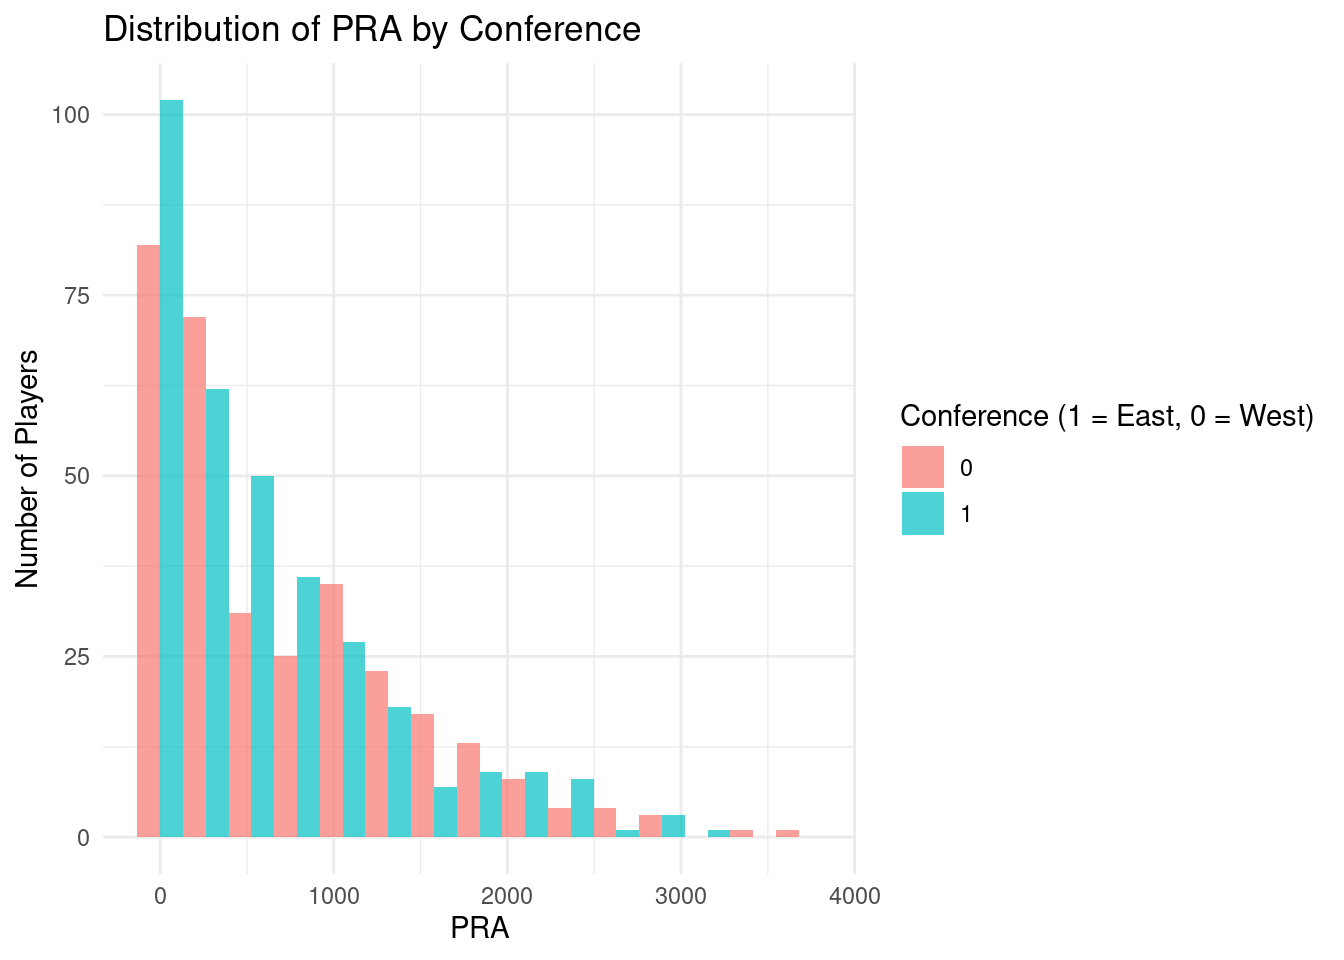
Most players have lower PRA values, and only a small number of players have very high totals. This results in a right-skewed distribution, where most players cluster at lower PRA values and fewer players appear at higher levels. Both the Eastern and Western Conferences follow this same pattern, and their results overlap a lot. This means there is not much difference in offensive performance between the two conferences. This matches the statistical test results, which showed that being in the East or West does not significantly predict how much offensive output a player has.
6.4 Point-biserial Correlations
cor_pra <- cor.test(nba_data$Conference_binary, nba_data$PRA)
cor_stocks <- cor.test(nba_data$Conference_binary, nba_data$STOCKS)

cor_pra
    Pearson's product-moment correlation

data:  nba_data$Conference_binary and nba_data$PRA
t = -1.8195, df = 650, p-value = 0.0693
alternative hypothesis: true correlation is not equal to 0
95 percent confidence interval:
 -0.147164250  0.005629906
sample estimates:
        cor
-0.07118475
cor_stocks
    Pearson's product-moment correlation

data:  nba_data$Conference_binary and nba_data$STOCKS
t = -2.094, df = 650, p-value = 0.03665
alternative hypothesis: true correlation is not equal to 0
95 percent confidence interval:
 -0.157650363 -0.005105577
sample estimates:
        cor
-0.08185737
6.5 Conference Differences
Point-biserial correlations were conducted to examine whether conference membership (East = 1, West = 0) was associated with offensive performance (PRA) and defensive performance (STOCKS).
Conference membership was not significantly related to PRA, r(650) = −.07, p = .069. Although the correlation was negative, the effect was small and did not reach conventional levels of statistical significance.
However, conference membership was significantly related to STOCKS, r(650) = −.08, p = .037. The effect size was small, indicating a very modest association between conference and defensive performance. The negative direction suggests that players in the East (coded 1) tended to have slightly lower STOCKS values compared to players in the West.
Overall, conference differences appear minimal and explain very little variation in overall player performance.
6.6 Correlation Matrix
cor_matrix <- nba_data %>%
  dplyr::select(Age, PRA, STOCKS) %>%
  cor(use = "pairwise.complete.obs")

ggcorrplot(cor_matrix, lab = TRUE, title = "Correlation Matrix: Age, PRA, STOCKS")
Warning: `aes_string()` was deprecated in ggplot2 3.0.0.
ℹ Please use tidy evaluation idioms with `aes()`.
ℹ See also `vignette("ggplot2-in-packages")` for more information.
ℹ The deprecated feature was likely used in the ggcorrplot package.
Please report the issue at <https://github.com/kassambara/ggcorrplot/issues>.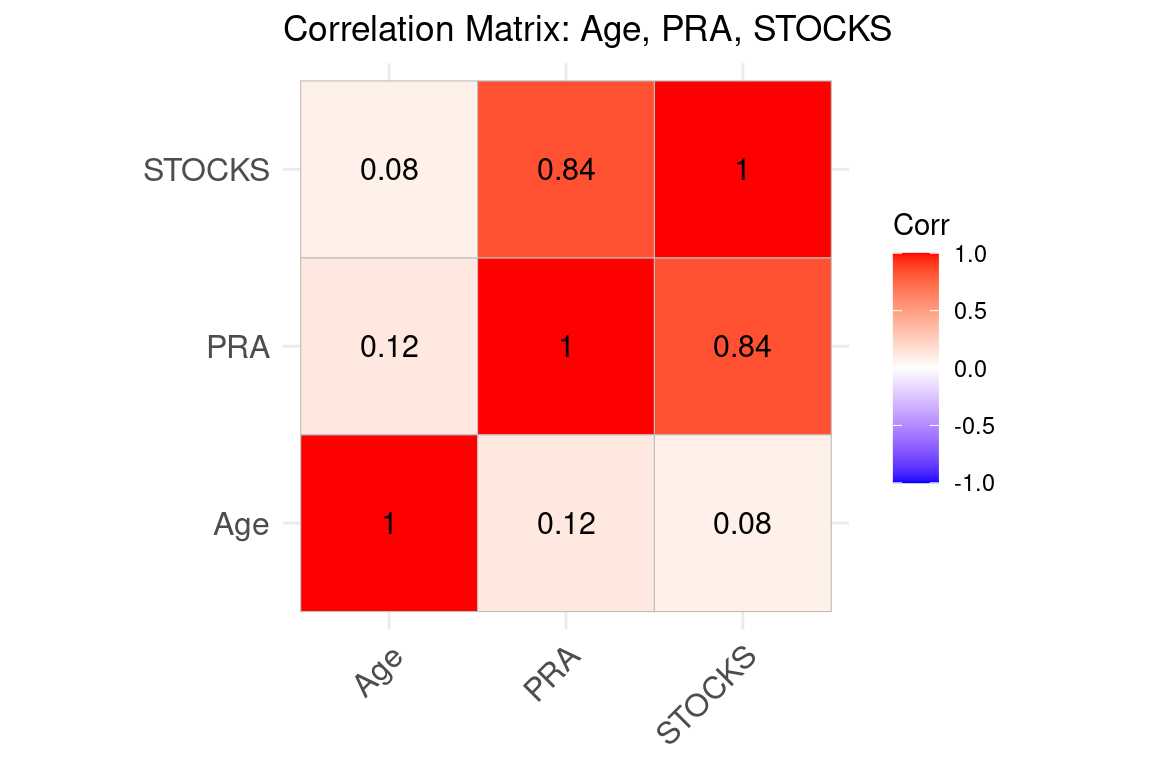
6.7 Partial Correlation
partial_res <- pcor.test(nba_data$PRA, nba_data$STOCKS, nba_data$Age)
partial_res
estimate p.value statistic n gp Method
1 0.8395996 3.657553e-174 39.37587 652 1 pearsonThe correlation matrix showed a positive relationship between PRA and STOCKS. This means that players who score, rebound, and assist more also tend to record more steals and blocks. In other words, strong offensive players often contribute defensively as well.
To determine whether this relationship was simply due to age differences, a partial correlation was conducted while controlling for Age. The relationship between PRA and STOCKS remained statistically significant even after accounting for age. This indicates that the connection between offensive and defensive performance is not just a result of players being younger or older. Instead, it reflects an overall pattern of player productivity.
Important
Point-biserial correlations were used to examine whether conference membership is related to PRA and STOCKS. The partial correlation was used to test the relationship between PRA and STOCKS while controlling for age, allowing us to separate overall performance patterns from age-related effects.
6.8 Conclusion
Overall, offensive performance (PRA) and defensive performance (STOCKS) are clearly related across players. Conference membership has only a very small effect on performance metrics, with a slight but statistically significant difference observed for defensive production. Age does not fully explain the relationship between offense and defense, suggesting that high-performing players tend to contribute in multiple areas of the game.