cache_file <- "data/nyc311_10000.csv"

get_311_api <- function(limit = 10000) {
  endpoint <- "https://data.cityofnewyork.us/resource/erm2-nwe9.json"
  resp <- httr::GET(endpoint, query = list("$limit" = limit))
  if (httr::status_code(resp) != 200) stop("NYC Open Data request failed.")

  jsonlite::fromJSON(httr::content(resp, as = "text"), flatten = TRUE) %>%
    as_tibble() %>%
    dplyr::select(borough, complaint_type, descriptor) %>%
    dplyr::mutate(
      borough = ifelse(is.na(borough) | borough == "", "Unspecified", borough)
    )
}

data_311 <- tryCatch(
  {
    df <- get_311_api(10000)
    dir.create("data", showWarnings = FALSE)
    readr::write_csv(df, cache_file)
    df
  },
  error = function(e) {
    if (file.exists(cache_file)) {
      readr::read_csv(cache_file, show_col_types = FALSE)
    } else {
      stop("Could not download NYC 311 data and no cached file exists at: ", cache_file)
    }
  }
)10 311
10.1 Intro
This report explores the NYC 311 dataset. New York City’s 311 system provides residents with a recourse to report quality-of-life issues, making it possible to understand neighborhood needs, and public concerns to address across New York City.
In this project, we explore:
- Which boroughs have the most 311 complaints
- What the most common complaint types are
- How these patterns differ by borough
- The reasons behind common complaints
Warning
This chapter includes a Shiny app in the original project. Quarto Books render as static websites, so the live Shiny app cannot run inside the book. The code is included for reproducibility, and the app can be launched locally from this chapter.
10.2 First 20 Rows of Dataset
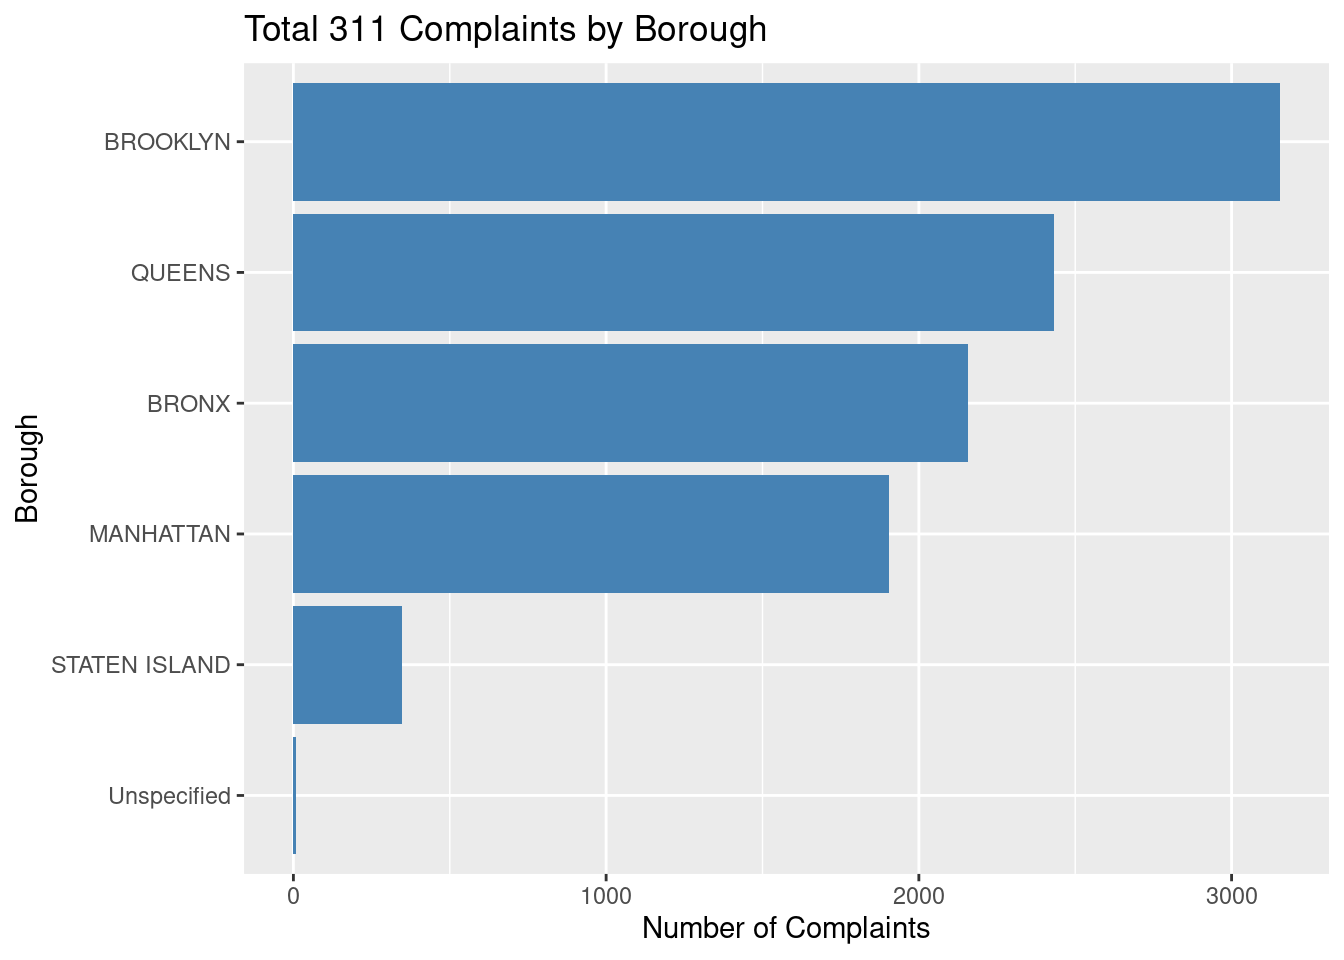
10.3 Here is the summary of total complaints per borough
borough_counts <- data_311 %>%
  count(borough, sort = TRUE)

knitr::kable(borough_counts)| borough | n |
|---|---|
| BROOKLYN | 3155 |
| QUEENS | 2431 |
| BRONX | 2156 |
| MANHATTAN | 1905 |
| STATEN ISLAND | 346 |
| Unspecified | 7 |
10.4 Shiny App
ui <- fluidPage(
  titlePanel("NYC 311 Explorer"),
  sidebarLayout(
    sidebarPanel(
      selectInput(
        "boro", "Choose a Borough:",
        choices = c("BRONX","BROOKLYN","MANHATTAN","QUEENS","STATEN ISLAND","Unspecified")
      ),
      selectInput(
        "ctype", "Choose a Complaint Type:",
        choices = sort(unique(data_311$complaint_type))
      ),
      sliderInput(
        "top_n", "Number of Top Complaint Types:",
        min = 5, max = 20, value = 10
      )
    ),
    mainPanel(
      textOutput("summary"),
      plotOutput("plot"),
      h3("Top Reasons (Descriptors) for Selected Complaint Type"),
      plotOutput("reason_plot"),
      DTOutput("table")
    )
  )
)

server <- function(input, output) {

  output$summary <- renderText({
    data_311 %>%
      filter(borough == input$boro) %>%
      nrow() %>%
      paste("Total complaints in", input$boro, ":", .)
  })

  output$plot <- renderPlot({
    data_311 %>%
      filter(borough == input$boro) %>%
      count(complaint_type, sort = TRUE) %>%
      slice_head(n = input$top_n) %>%
      ggplot(aes(x = n, y = fct_reorder(complaint_type, n))) +
      geom_col(fill = "steelblue") +
      labs(
        title = paste("Top", input$top_n, "Complaints in", input$boro),
        x = "Count",
        y = "Complaint Type"
      )
  })

  output$table <- renderDT({
    data_311 %>%
      filter(borough == input$boro)
  })

  output$reason_plot <- renderPlot({
    data_311 %>%
      filter(
        borough == input$boro,
        complaint_type == input$ctype
      ) %>%
      count(descriptor, sort = TRUE) %>%
      slice_head(n = 10) %>%
      ggplot(aes(x = n, y = fct_reorder(descriptor, n))) +
      geom_col(fill = "darkorange") +
      labs(
        title = paste("Top Reasons for", input$ctype, "in", input$boro),
        x = "Number of Complaints",
        y = "Descriptor"
      ) +
      coord_flip()
  })
}

shinyApp(ui, server)
10.5 Based on the most recent 10,000 NYC 311 complaints:
- Bronx (2,541 total complaints) has the most complaints about noise.
- Brooklyn (2,681) has the most complaints about illegal parking.
- Manhattan (2,077) has the most complaints about noise.
- Queens (2,412) has most complaints about illegal parking.
- Staten Island (284) has most complaints about illegal parking.
- Unspecified (5) is mostly taxi complaints.
Overall, Brooklyn had the highest number of complaints compared to the other boroughs.
Most complaint types have more specific reasons stored in the descriptor column. It is critical to know the exact reason why complaints are being made so that New York City can address the issues properly and serve our people.
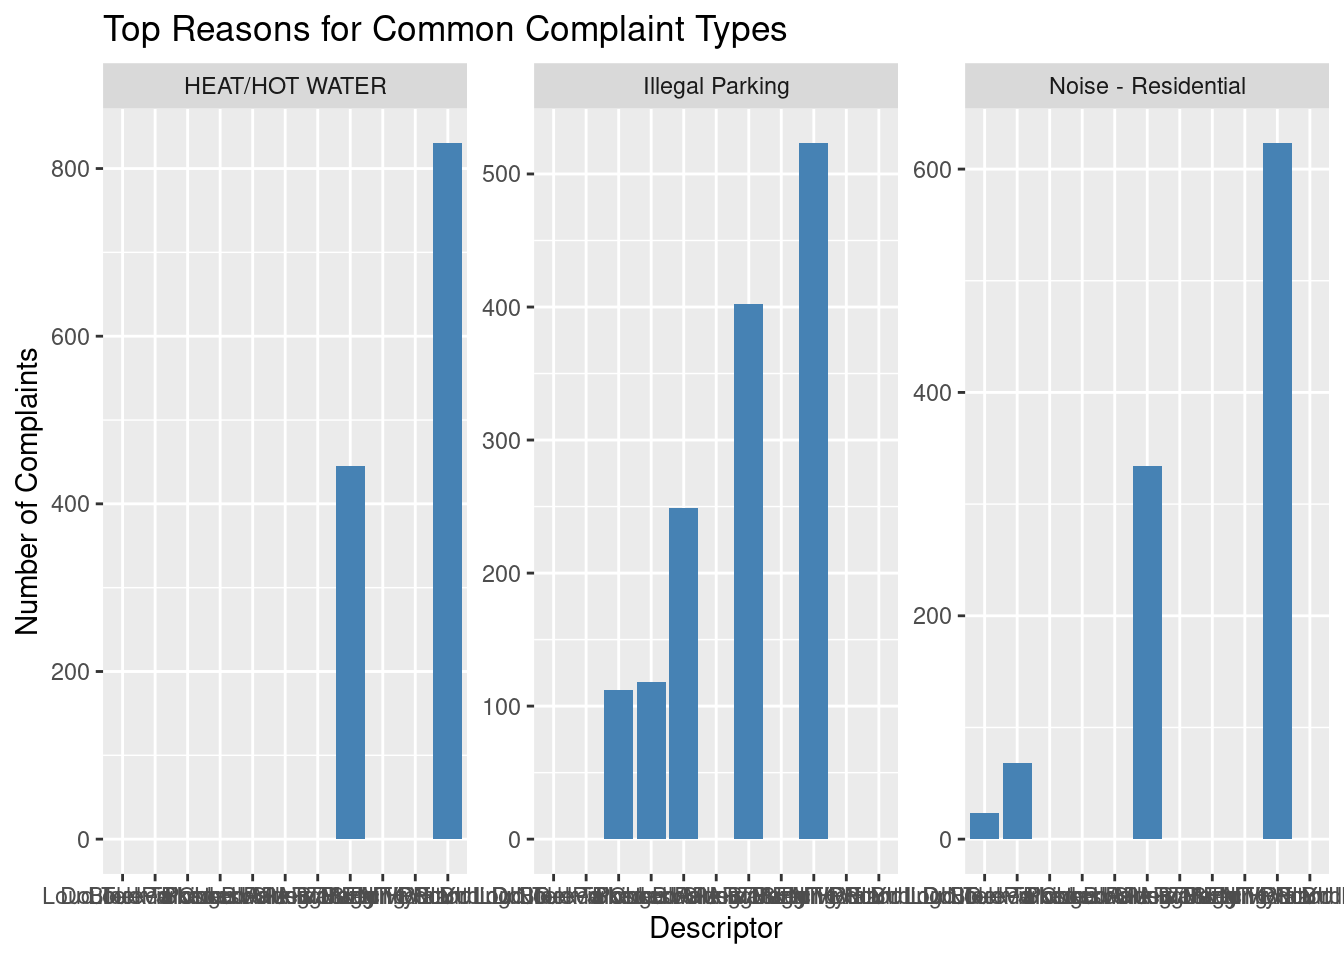
Here, we see the top 3 complaint types overall (heat/hot water, noise and parking violations), and then find the most common reasons associated with them.
WarningData limitation
This report uses a sample of 10,000 311 requests, not the full NYC 311 dataset. Because the API returns a limited number of records per request, the counts shown here reflect the sample pulled at the time of analysis. Patterns are still useful for exploring common issues, but exact totals may change across different samples or time windows.
top_types <- data_311 %>%
  count(complaint_type, sort = TRUE) %>%
  slice_head(n = 3) %>%
  pull(complaint_type)

knitr::kable(data.frame(Top_Complaint_Types = top_types))| Top_Complaint_Types |
|---|
| Illegal Parking |
| HEAT/HOT WATER |
| Noise - Residential |
top_reasons <- data_311 %>%
  filter(complaint_type %in% top_types) %>%
  count(complaint_type, descriptor, sort = TRUE) %>%
  group_by(complaint_type) %>%
  slice_max(n, n = 5) %>%
  ungroup()

knitr::kable(top_reasons)| complaint_type | descriptor | n |
|---|---|---|
| HEAT/HOT WATER | ENTIRE BUILDING | 830 |
| HEAT/HOT WATER | APARTMENT ONLY | 445 |
| Illegal Parking | Blocked Hydrant | 523 |
| Illegal Parking | Posted Parking Sign Violation | 402 |
| Illegal Parking | Blocked Sidewalk | 249 |
| Illegal Parking | Double Parked Blocking Traffic | 118 |
| Illegal Parking | Blocked Crosswalk | 112 |
| Noise - Residential | Banging/Pounding | 623 |
| Noise - Residential | Loud Music/Party | 334 |
| Noise - Residential | Loud Talking | 68 |
| Noise - Residential | Loud Television | 23 |
10.6 We can see that:
For heat and hot water complaints, the majority of issues were being reported for an entire building, rather than a single residence, showing widespread service outages need to be addressed.
For illegal parking complaints, most were related to blocked fire hydrants.
For noise complaints, most were residential complaints reporting loud music from parties.
This not only show how many complaints there are across New York City, but starts to answer the questions: What are people complaining about, and how can we address these issues?
This knowledge can help us put programs into place to help provide NYC residents with the help they need to improve quality of life.